
Generative AI
Tracing OpenClaw with OpenTelemetry and Orq.ai
How to get full observability into your OpenClaw agent with OTEL tracing, and a simpler alternative using the Orq AI Router.
February 12, 2026

Bauke Brenninkmeijer
Research Engineer

When you run an AI agent in production, you need to know what it's doing. Which model did it call? How many tokens did it use? How long did the inference take? Did a tool call fail silently? Without tracing, your agent is a black box.
The need for visibility has never been more urgent. In early 2026, security audits of the ClawHub skills marketplace uncovered 341 trojanized skill packages that silently installed credential stealers, while a broader scan by Snyk found that 7% of all published skills exposed secrets in plaintext. These attacks succeed precisely because operators have no visibility into what their agents are doing -- a malicious skill making unexpected network calls or exfiltrating data looks the same as a legitimate one when you have no tracing. Observability turns that blind spot into an auditable trail of every tool call, every model interaction, and every piece of data flowing through your agent.
Problems like these are easily solved with an online eval checking for api keys in traces, giving you a notification when they occur. But for that, you need insight into what is happening.
OpenClaw ships with a built-in OpenTelemetry (OTEL) diagnostics plugin, and with the recent collaborative efforts of Orq.ai and several others, this gives you full visibility into every model call, tool execution, and message flow. And if you use Orq.ai as your observability backend, you can view all of this in a purpose-built AI tracing UI.
This post covers two ways to get tracing working:
Full OTEL setup -- send traces from OpenClaw to Orq.ai (or any OTEL-compatible backend)
Use the Orq AI Router -- get automatic tracing on every LLM call with zero OTEL configuration
Why trace your agent?
Running an agentic AI system means many things happen behind the scenes: model inference calls, tool executions, retries, token usage, and cost accumulation. Tracing lets you:
Debug failures -- see exactly which step in a multi-turn conversation went wrong
Monitor costs -- track token usage and cost per model call
Optimize latency -- identify slow inference calls or tool executions
Audit behavior -- review what your agent said, which tools it called, and why
Set up automations -- trigger alerts, evaluations, or dataset collection based on trace data
Option 1: Full OTEL tracing
OpenClaw's diagnostics-otel plugin exports traces, metrics, and logs using the OpenTelemetry Protocol (OTLP). It follows the GenAI semantic conventions, so traces work out-of-the-box with GenAI-aware backends like Orq.ai, Datadog, Grafana, Langfuse, and Arize.
What gets traced
The plugin creates a hierarchy of spans for each agent interaction:
openclaw.agent.turn (root span)
  +-- chat gpt-5.2 (model inference)
  +-- execute_tool web_search
  +-- execute_tool read_file
  +-- chat gpt-5.2 (second inference call)
Each span includes attributes like:
The model and provider used.
Input and output tokens
Stop reason
Tool names, call IDs, and execution duration
Setup: Send traces to Orq.ai
Add this to your OpenClaw config (~/.openclaw/openclaw.json):
{
  "plugins": {
    "entries": {
      "diagnostics-otel": { "enabled": true }
    }
  },
  "diagnostics": {
    "enabled": true,
    "otel": {
      "enabled": true,
      "endpoint": "https://api.orq.ai/v2/otel",
      "serviceName": "my-openclaw-agent",
      "traces": true,
      "metrics": true,
      "logs": false,
      "headers": {
        "Authorization": "Bearer orq_..."
      },
      "captureContent": true
    }
  }
}
Make sure to replace orq_… with your actual key, as environment templating is not supported at this time.
Note: The diagnostics-otel plugin is disabled by default. You must explicitly enable it via the plugins.entries section as shown above.
Note: The OTEL endpoint expects the API key as a Bearer token in the Authorization header ("Bearer orq_..."), while the Orq Router expects it in the apiKey field directly ("orq_..."). Both use the same Orq API key.
That's it. Restart your OpenClaw gateway and traces will start appearing in the Orq.ai Traces dashboard.
The plugin uses http/protobuf and automatically appends /v1/traces, /v1/metrics, and /v1/logs to the endpoint.
Optional: capture message content
By default, message content is not included in traces (for privacy). To include the actual prompts and responses. We have this enabled in the snippet above already.
{
  "diagnostics": {
    "enabled": true,
    "otel": {
      "enabled": true,
      "endpoint": "https://api.orq.ai/v2/otel",
      "headers": { "Authorization": "Bearer orq_..." },
      "captureContent": true
    }
  }
}
Warning: Enabling captureContent records all prompts and model responses in your traces. Only enable this in environments where you're comfortable storing that data.
Debugging OTEL export
If traces aren't showing up, enable debug logging:
export OPENCLAW_OTEL_DEBUG=true
openclaw gateway run
You'll see output like:
diagnostics-otel: exporting 5 spans. first=chat gpt-5.2
diagnostics-otel: span created execute_tool web_search
To dump all spans to a local file for inspection:
export OPENCLAW_OTEL_DUMP=/tmp/otel-spans.jsonl
openclaw gateway run
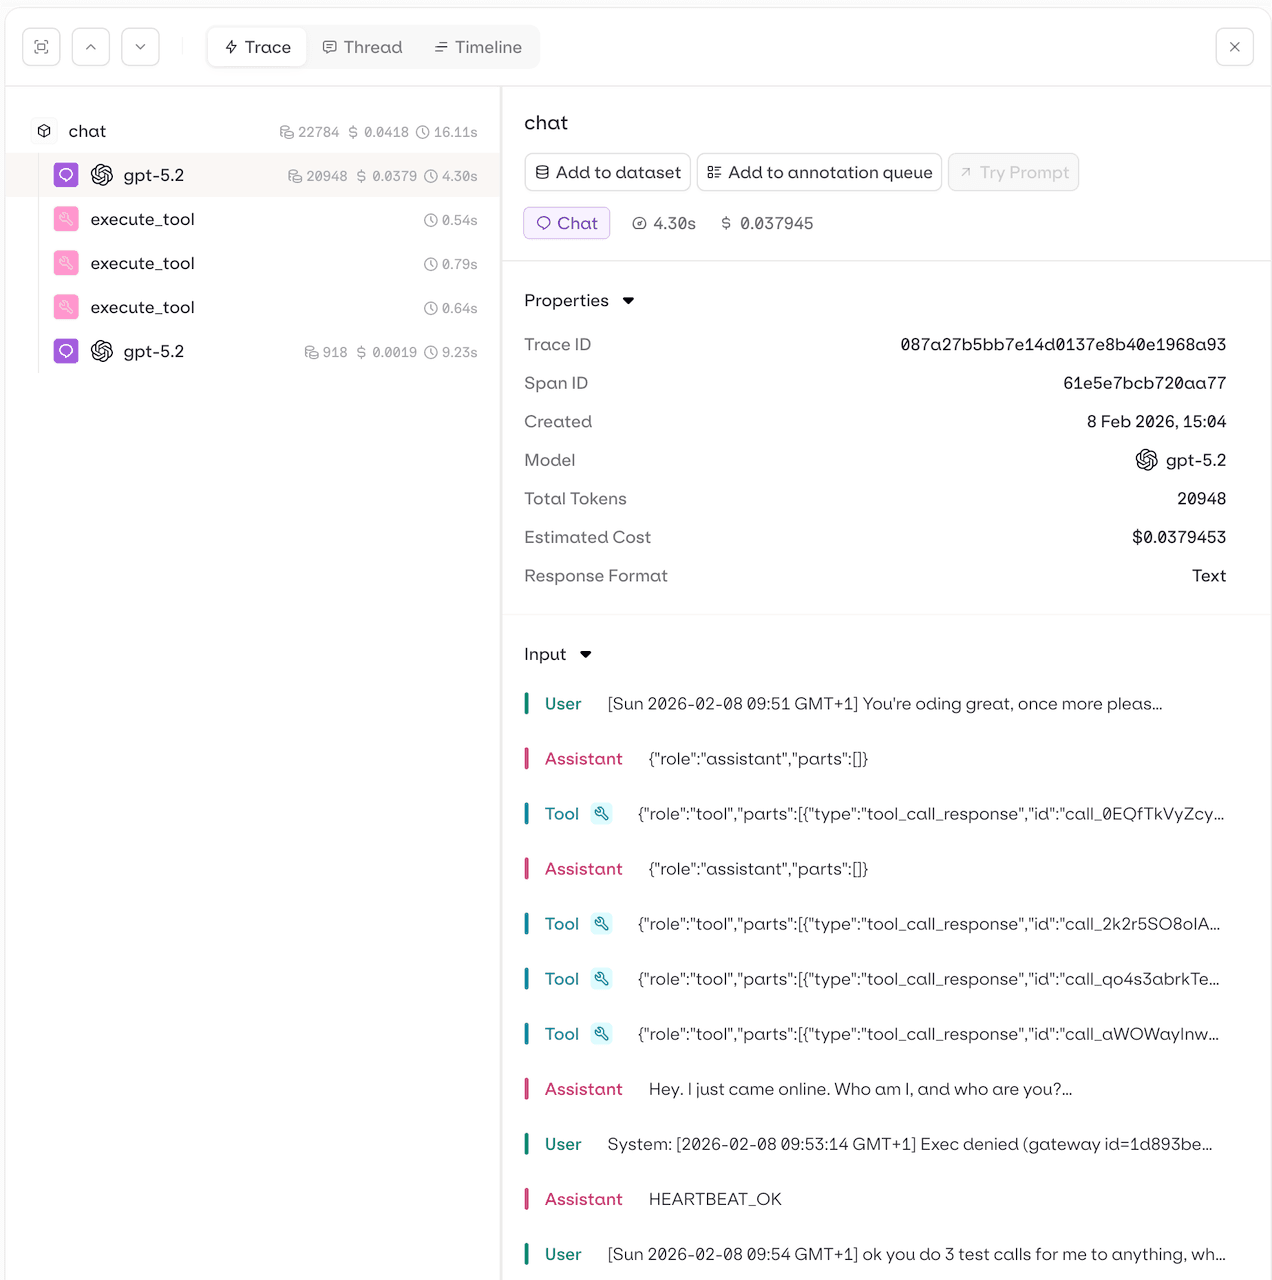
Screenshot for OTEL Tracing Openclaw on Orq.ai
Option 2: Use the Orq.ai AI Router (simpler alternative)
If you don't want to set up OTEL infrastructure, there's a much simpler path: route your LLM calls through the Orq AI Router. When you do this, Orq.ai automatically traces every model call -- no OTEL configuration needed.
The Orq Router is an OpenAI-compatible proxy that sits between OpenClaw and your model providers. Every request that flows through it is automatically logged, traced, and visible in the Orq.ai dashboard.
Setup: Add Orq.ai as a provider
Add the Orq provider to your OpenClaw config (~/.openclaw/openclaw.json). You'll need an API key from Orq.ai -- replace orq_... with your actual key:
{
  "agents": {
    "defaults": {
      "model": { "primary": "orq/openai/gpt-5.2" }
    }
  },
  "models": {
    "providers": {
      "orq": {
        "baseUrl": "https://api.orq.ai/v2/router",
        "apiKey": "orq_...",
        "api": "openai-completions",
        "models": [
          { "id": "anthropic/claude-sonnet-4-5-20250929", "name": "Claude Sonnet 4.5" },
          { "id": "anthropic/claude-haiku-4-5-20251001", "name": "Claude Haiku 4.5" },
          { "id": "openai/gpt-5.2", "name": "GPT-5.2" },
          { "id": "openai/gpt-5-mini", "name": "GPT-5 Mini" },
          { "id": "google-ai/gemini-2.5-pro", "name": "Gemini 2.5 Pro" },
          { "id": "google-ai/gemini-2.5-flash", "name": "Gemini 2.5 Flash" }
        ]
      }
    }
  }
}
The key things to note:
baseUrlpoints to the Orq AI Router endpoint.api: "openai-completions"tells OpenClaw to use the OpenAI-compatible API format (use"openai-responses"if you prefer the Responses format, but not all models support this).Model IDs include a provider prefix (e.g.
openai/gpt-5.2), so you reference them asorq/openai/gpt-5.2in your config.Orq uses
google-ai/*for Google AI Studio models andgoogle/*for Vertex AI (GCP) models.
Restart your gateway and every LLM call will now flow through the Orq Router. You can view traces in the Orq.ai Router Traces dashboard -- filter by model, provider, status, cost, or duration.
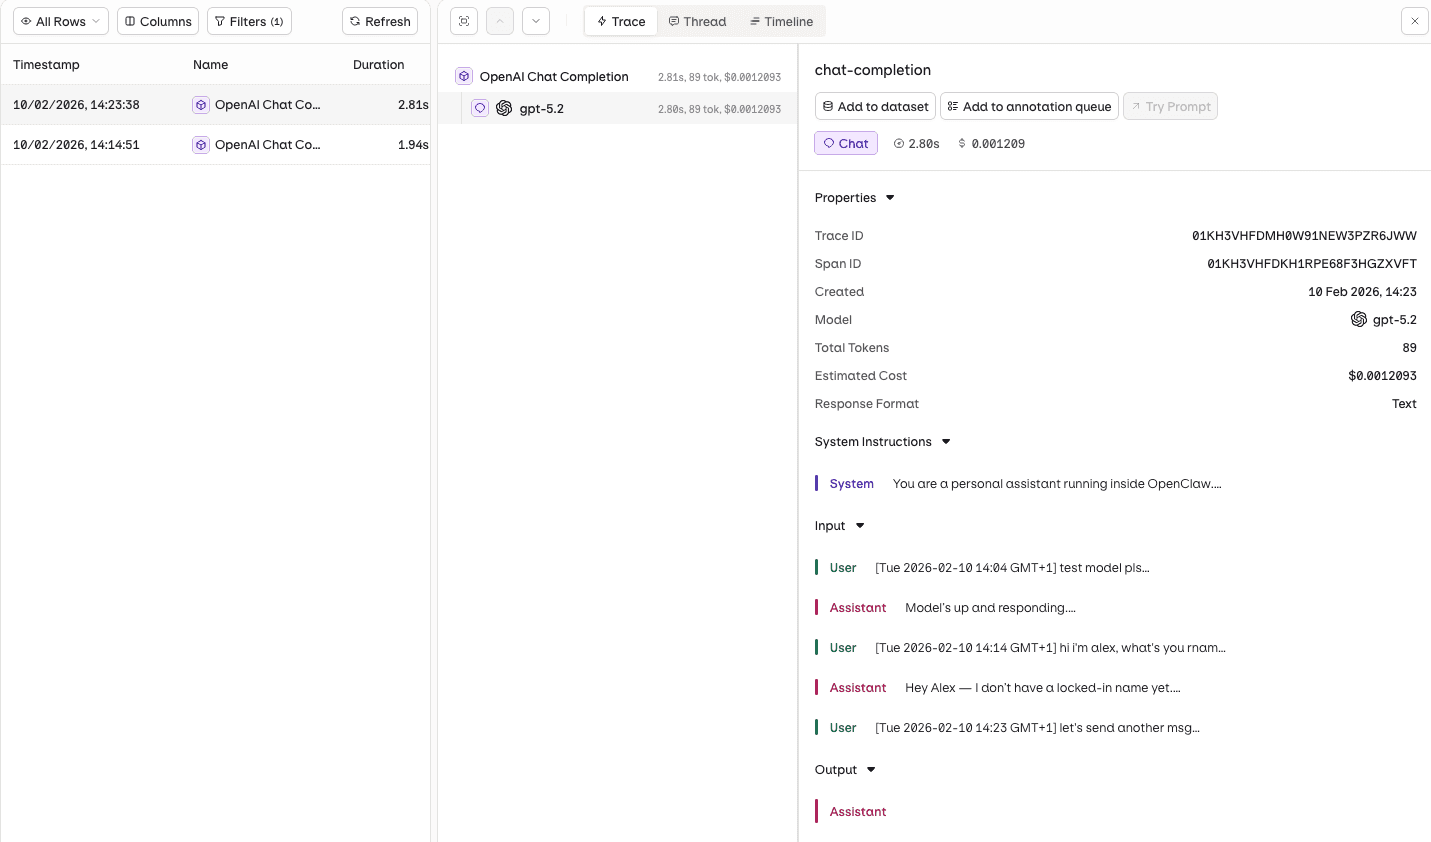
Screenshot Router-based tracing openclaw through Orq.ai
Coming soon: Orq.ai as a built-in provider
We're adding Orq as a predefined provider in the OpenClaw onboarding flow. Once landed, you'll be able to select Orq from the list of providers when running openclaw onboard, and it will configure the base URL, model catalog, and API format for you -- you'll just need to provide your API key. See PR #TODO for progress.
When to use which approach
OTEL Plugin | Orq Router | |
|---|---|---|
Setup complexity | Moderate (config + endpoint) | Minimal (just add provider) |
What's traced | Model calls, tool executions, message flow, webhooks, sessions | Model calls (inference only) |
Works with any backend | Yes (any OTLP-compatible collector) | Orq.ai only |
Traces tool calls | Yes | No |
Traces agent turns | Yes | No |
Custom metrics | Yes (token usage, cost, latency histograms) | Built into Orq dashboard |
Requires OTEL knowledge | Some | None |
TL;DR: Use the Orq Router if you just want to see your LLM calls traced with minimal setup. Use the OTEL plugin if you want full agent-level observability with tool execution spans, custom metrics, and the flexibility to send traces to any backend.
Combining both
You can use both approaches together. Route your LLM calls through the Orq Router and enable the OTEL plugin to send agent-level traces to Orq.ai. This gives you the best of both worlds: automatic router-level traces for every model call, plus detailed agent-level spans for tool executions and message flow.
{
  "plugins": {
    "entries": {
      "diagnostics-otel": { "enabled": true }
    }
  },
  "models": {
    "providers": {
      "orq": {
        "baseUrl": "https://api.orq.ai/v2/router",
        "apiKey": "orq_...",
        "api": "openai-completions",
        "models": [
          { "id": "openai/gpt-5.2", "name": "GPT-5.2" }
        ]
      }
    }
  },
  "diagnostics": {
    "enabled": true,
    "otel": {
      "enabled": true,
      "endpoint": "https://api.orq.ai/v2/otel",
      "headers": { "Authorization": "Bearer orq_..." },
      "traces": true,
      "metrics": true
    }
  }
}
Conclusion
If you're just getting started with OpenClaw, it's tempting to skip tracing -- everything looks fine in your terminal. But the moment you connect a channel like Telegram or WhatsApp, you lose that visibility. Skills fail silently, costs creep up, and you have no way to tell.
We'd recommend adding tracing early. Start with the Orq Router; just add it as a provider in your openclaw.json and you'll immediately see every LLM call in the Orq.ai dashboard. No OTEL setup needed. Once your agent grows more complex with sub-agents, tools, and multi-turn conversations, add the OTEL plugin for full agent-level tracing. Both live in the same config file and work side by side.
Further reading
When you run an AI agent in production, you need to know what it's doing. Which model did it call? How many tokens did it use? How long did the inference take? Did a tool call fail silently? Without tracing, your agent is a black box.
The need for visibility has never been more urgent. In early 2026, security audits of the ClawHub skills marketplace uncovered 341 trojanized skill packages that silently installed credential stealers, while a broader scan by Snyk found that 7% of all published skills exposed secrets in plaintext. These attacks succeed precisely because operators have no visibility into what their agents are doing -- a malicious skill making unexpected network calls or exfiltrating data looks the same as a legitimate one when you have no tracing. Observability turns that blind spot into an auditable trail of every tool call, every model interaction, and every piece of data flowing through your agent.
Problems like these are easily solved with an online eval checking for api keys in traces, giving you a notification when they occur. But for that, you need insight into what is happening.
OpenClaw ships with a built-in OpenTelemetry (OTEL) diagnostics plugin, and with the recent collaborative efforts of Orq.ai and several others, this gives you full visibility into every model call, tool execution, and message flow. And if you use Orq.ai as your observability backend, you can view all of this in a purpose-built AI tracing UI.
This post covers two ways to get tracing working:
Full OTEL setup -- send traces from OpenClaw to Orq.ai (or any OTEL-compatible backend)
Use the Orq AI Router -- get automatic tracing on every LLM call with zero OTEL configuration
Why trace your agent?
Running an agentic AI system means many things happen behind the scenes: model inference calls, tool executions, retries, token usage, and cost accumulation. Tracing lets you:
Debug failures -- see exactly which step in a multi-turn conversation went wrong
Monitor costs -- track token usage and cost per model call
Optimize latency -- identify slow inference calls or tool executions
Audit behavior -- review what your agent said, which tools it called, and why
Set up automations -- trigger alerts, evaluations, or dataset collection based on trace data
Option 1: Full OTEL tracing
OpenClaw's diagnostics-otel plugin exports traces, metrics, and logs using the OpenTelemetry Protocol (OTLP). It follows the GenAI semantic conventions, so traces work out-of-the-box with GenAI-aware backends like Orq.ai, Datadog, Grafana, Langfuse, and Arize.
What gets traced
The plugin creates a hierarchy of spans for each agent interaction:
openclaw.agent.turn (root span)
  +-- chat gpt-5.2 (model inference)
  +-- execute_tool web_search
  +-- execute_tool read_file
  +-- chat gpt-5.2 (second inference call)
Each span includes attributes like:
The model and provider used.
Input and output tokens
Stop reason
Tool names, call IDs, and execution duration
Setup: Send traces to Orq.ai
Add this to your OpenClaw config (~/.openclaw/openclaw.json):
{
  "plugins": {
    "entries": {
      "diagnostics-otel": { "enabled": true }
    }
  },
  "diagnostics": {
    "enabled": true,
    "otel": {
      "enabled": true,
      "endpoint": "https://api.orq.ai/v2/otel",
      "serviceName": "my-openclaw-agent",
      "traces": true,
      "metrics": true,
      "logs": false,
      "headers": {
        "Authorization": "Bearer orq_..."
      },
      "captureContent": true
    }
  }
}
Make sure to replace orq_… with your actual key, as environment templating is not supported at this time.
Note: The diagnostics-otel plugin is disabled by default. You must explicitly enable it via the plugins.entries section as shown above.
Note: The OTEL endpoint expects the API key as a Bearer token in the Authorization header ("Bearer orq_..."), while the Orq Router expects it in the apiKey field directly ("orq_..."). Both use the same Orq API key.
That's it. Restart your OpenClaw gateway and traces will start appearing in the Orq.ai Traces dashboard.
The plugin uses http/protobuf and automatically appends /v1/traces, /v1/metrics, and /v1/logs to the endpoint.
Optional: capture message content
By default, message content is not included in traces (for privacy). To include the actual prompts and responses. We have this enabled in the snippet above already.
{
  "diagnostics": {
    "enabled": true,
    "otel": {
      "enabled": true,
      "endpoint": "https://api.orq.ai/v2/otel",
      "headers": { "Authorization": "Bearer orq_..." },
      "captureContent": true
    }
  }
}
Warning: Enabling captureContent records all prompts and model responses in your traces. Only enable this in environments where you're comfortable storing that data.
Debugging OTEL export
If traces aren't showing up, enable debug logging:
export OPENCLAW_OTEL_DEBUG=true
openclaw gateway run
You'll see output like:
diagnostics-otel: exporting 5 spans. first=chat gpt-5.2
diagnostics-otel: span created execute_tool web_search
To dump all spans to a local file for inspection:
export OPENCLAW_OTEL_DUMP=/tmp/otel-spans.jsonl
openclaw gateway run
Screenshot for OTEL Tracing Openclaw on Orq.ai
Option 2: Use the Orq.ai AI Router (simpler alternative)
If you don't want to set up OTEL infrastructure, there's a much simpler path: route your LLM calls through the Orq AI Router. When you do this, Orq.ai automatically traces every model call -- no OTEL configuration needed.
The Orq Router is an OpenAI-compatible proxy that sits between OpenClaw and your model providers. Every request that flows through it is automatically logged, traced, and visible in the Orq.ai dashboard.
Setup: Add Orq.ai as a provider
Add the Orq provider to your OpenClaw config (~/.openclaw/openclaw.json). You'll need an API key from Orq.ai -- replace orq_... with your actual key:
{
  "agents": {
    "defaults": {
      "model": { "primary": "orq/openai/gpt-5.2" }
    }
  },
  "models": {
    "providers": {
      "orq": {
        "baseUrl": "https://api.orq.ai/v2/router",
        "apiKey": "orq_...",
        "api": "openai-completions",
        "models": [
          { "id": "anthropic/claude-sonnet-4-5-20250929", "name": "Claude Sonnet 4.5" },
          { "id": "anthropic/claude-haiku-4-5-20251001", "name": "Claude Haiku 4.5" },
          { "id": "openai/gpt-5.2", "name": "GPT-5.2" },
          { "id": "openai/gpt-5-mini", "name": "GPT-5 Mini" },
          { "id": "google-ai/gemini-2.5-pro", "name": "Gemini 2.5 Pro" },
          { "id": "google-ai/gemini-2.5-flash", "name": "Gemini 2.5 Flash" }
        ]
      }
    }
  }
}
The key things to note:
baseUrlpoints to the Orq AI Router endpoint.api: "openai-completions"tells OpenClaw to use the OpenAI-compatible API format (use"openai-responses"if you prefer the Responses format, but not all models support this).Model IDs include a provider prefix (e.g.
openai/gpt-5.2), so you reference them asorq/openai/gpt-5.2in your config.Orq uses
google-ai/*for Google AI Studio models andgoogle/*for Vertex AI (GCP) models.
Restart your gateway and every LLM call will now flow through the Orq Router. You can view traces in the Orq.ai Router Traces dashboard -- filter by model, provider, status, cost, or duration.
Screenshot Router-based tracing openclaw through Orq.ai
Coming soon: Orq.ai as a built-in provider
We're adding Orq as a predefined provider in the OpenClaw onboarding flow. Once landed, you'll be able to select Orq from the list of providers when running openclaw onboard, and it will configure the base URL, model catalog, and API format for you -- you'll just need to provide your API key. See PR #TODO for progress.
When to use which approach
OTEL Plugin | Orq Router | |
|---|---|---|
Setup complexity | Moderate (config + endpoint) | Minimal (just add provider) |
What's traced | Model calls, tool executions, message flow, webhooks, sessions | Model calls (inference only) |
Works with any backend | Yes (any OTLP-compatible collector) | Orq.ai only |
Traces tool calls | Yes | No |
Traces agent turns | Yes | No |
Custom metrics | Yes (token usage, cost, latency histograms) | Built into Orq dashboard |
Requires OTEL knowledge | Some | None |
TL;DR: Use the Orq Router if you just want to see your LLM calls traced with minimal setup. Use the OTEL plugin if you want full agent-level observability with tool execution spans, custom metrics, and the flexibility to send traces to any backend.
Combining both
You can use both approaches together. Route your LLM calls through the Orq Router and enable the OTEL plugin to send agent-level traces to Orq.ai. This gives you the best of both worlds: automatic router-level traces for every model call, plus detailed agent-level spans for tool executions and message flow.
{
  "plugins": {
    "entries": {
      "diagnostics-otel": { "enabled": true }
    }
  },
  "models": {
    "providers": {
      "orq": {
        "baseUrl": "https://api.orq.ai/v2/router",
        "apiKey": "orq_...",
        "api": "openai-completions",
        "models": [
          { "id": "openai/gpt-5.2", "name": "GPT-5.2" }
        ]
      }
    }
  },
  "diagnostics": {
    "enabled": true,
    "otel": {
      "enabled": true,
      "endpoint": "https://api.orq.ai/v2/otel",
      "headers": { "Authorization": "Bearer orq_..." },
      "traces": true,
      "metrics": true
    }
  }
}
Conclusion
If you're just getting started with OpenClaw, it's tempting to skip tracing -- everything looks fine in your terminal. But the moment you connect a channel like Telegram or WhatsApp, you lose that visibility. Skills fail silently, costs creep up, and you have no way to tell.
We'd recommend adding tracing early. Start with the Orq Router; just add it as a provider in your openclaw.json and you'll immediately see every LLM call in the Orq.ai dashboard. No OTEL setup needed. Once your agent grows more complex with sub-agents, tools, and multi-turn conversations, add the OTEL plugin for full agent-level tracing. Both live in the same config file and work side by side.

